21. Drawing shapes
21.1. Dr. Tirthajyoti Sarkar, Fremont CA 94536
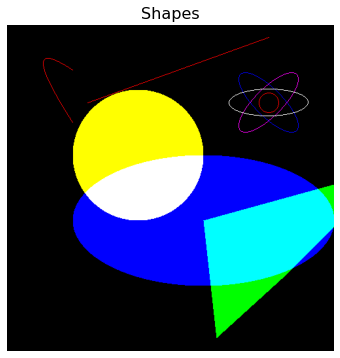
This example shows how to draw several different shapes:
line
Bezier curve
polygon
circle
ellipse
Anti-aliased drawing for:
line
circle
import math
import numpy as np
import matplotlib.pyplot as plt

from skimage.draw import (line, polygon, circle,
                          circle_perimeter,
                          ellipse, ellipse_perimeter,
                          bezier_curve)
from skimage.draw import line_aa, circle_perimeter_aa
21.2. Blank canvas
img = np.zeros((500, 500, 3), dtype=np.double)
img = np.zeros((500, 500, 3))
21.3. Draw line
rr, cc = line(120, 123, 20, 400)
img[rr, cc, 0] = 255
21.4. Fill polygon
poly = np.array((
    (300, 300),
    (480, 320),
    (380, 430),
    (220, 590),
    (300, 300),
))

rr, cc = polygon(poly[:, 0], poly[:, 1], img.shape)
img[rr, cc, 1] = 1
21.5. Fill circle
rr, cc = circle(200, 200, 100, img.shape)
img[rr, cc, :] = (1, 1, 0)
c:\program files\python37\lib\site-packages\ipykernel_launcher.py:1: FutureWarning: circle is deprecated in favor of disk.circle will be removed in version 0.19
  """Entry point for launching an IPython kernel.
21.6. Fill ellipse
rr, cc = ellipse(300, 300, 100, 200, img.shape)
img[rr, cc, 2] = 1
21.7. Circle
rr, cc = circle_perimeter(120, 400, 15)
img[rr, cc, :] = (1, 0, 0)
21.8. Bezier curve
rr, cc = bezier_curve(70, 100, 10, 10, 150, 100, 1)
img[rr, cc, :] = (1, 0, 0)
21.9. Ellipses
rr, cc = ellipse_perimeter(120, 400, 60, 20, orientation=math.pi / 4.)
img[rr, cc, :] = (1, 0, 1)
rr, cc = ellipse_perimeter(120, 400, 60, 20, orientation=-math.pi / 4.)
img[rr, cc, :] = (0, 0, 1)
rr, cc = ellipse_perimeter(120, 400, 60, 20, orientation=math.pi / 2.)
img[rr, cc, :] = (1, 1, 1)
fig, ax1 = plt.subplots(ncols=1, nrows=1, figsize=(6, 6))
ax1.imshow(img)
ax1.set_title('Shapes',fontsize=16)
ax1.axis('off')
plt.show()
Clipping input data to the valid range for imshow with RGB data ([0..1] for floats or [0..255] for integers).
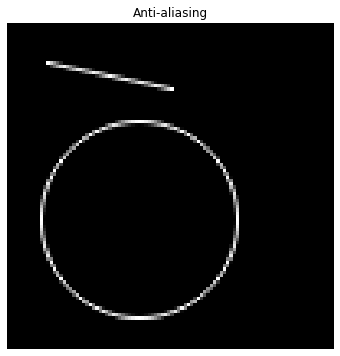
21.10. Anti-aliasing drwaing
img = np.zeros((100, 100), dtype=np.double)

# anti-aliased line
rr, cc, val = line_aa(12, 12, 20, 50)
img[rr, cc] = val

# anti-aliased circle
rr, cc, val = circle_perimeter_aa(60, 40, 30)
img[rr, cc] = val

fig, ax2 = plt.subplots(ncols=1, nrows=1, figsize=(6, 6))
ax2.imshow(img, cmap=plt.cm.gray, interpolation='nearest')
ax2.set_title('Anti-aliasing')
ax2.axis('off')

plt.show()