17. Generating random shapes
This notebook demonstrates generation of random shapes with various properties.
It uses the random_shapes() function from skimage.draw.
import matplotlib.pyplot as plt

from skimage.draw import random_shapes
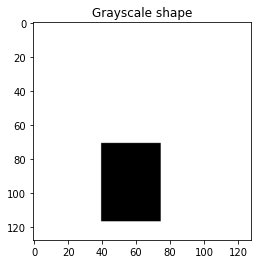
17.1. Let’s start simple and generate a 128x128 image with a single grayscale rectangle.
We get back a tuple consisting of
The image with the generated shapes and
A list of label tuples with the kind of shape (e.g. circle, rectangle) and ((r0, r1), (c0, c1)) coordinates.
rect = random_shapes((128, 128), max_shapes=1, shape='rectangle',
                       multichannel=False)
image, labels = rect
print('Image shape: {}\nLabels: {}'.format(image.shape, labels))
Image shape: (128, 128)
Labels: [('rectangle', ((71, 117), (40, 75)))]
fig, ax = plt.subplots(nrows=1, ncols=1,figsize=(4,4))
ax.imshow(image, cmap='gray')
ax.set_title('Grayscale shape')
plt.show()

17.2. The generated images can be much more complex
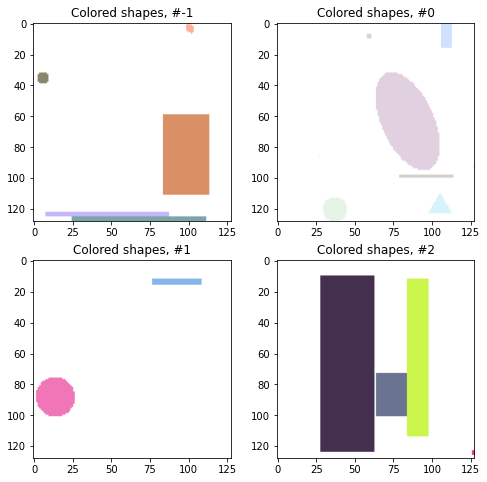
For example, let’s try many shapes of any color. If we want the colors to be particularly light, we can set the intensity_range to an upper subrange of (0,255).
image1, _ = random_shapes((128, 128), max_shapes=10,
                          intensity_range=((100, 255),))
image2, _ = random_shapes((128, 128), max_shapes=10,
                          intensity_range=((200, 255),))
image3, _ = random_shapes((128, 128), max_shapes=10,
                          intensity_range=((50, 255),))
image4, _ = random_shapes((128, 128), max_shapes=10,
                          intensity_range=((0, 255),))
fig, axes = plt.subplots(nrows=2, ncols=2,figsize=(8,8))
ax = axes.ravel()
for i, image in enumerate([image1, image2, image3, image4], 0):
    ax[i].imshow(image)
    ax[i].set_title('Colored shapes, #{}'.format(i-1))
plt.show()

17.3. Overlapping shapes
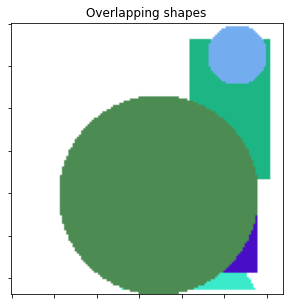
These shapes are well suited to test segmentation algorithms. Often, we want shapes to overlap to test the algorithm.
image, _ = random_shapes((128, 128), min_shapes=5, max_shapes=6,
                         min_size=20, allow_overlap=True)
fig, ax = plt.subplots(nrows=1, ncols=1,figsize=(5,5))
ax.imshow(image)
ax.set_title('Overlapping shapes')
ax.set_xticklabels([])
ax.set_yticklabels([])

plt.show()

