5. Block view functions
This example illustrates the use of view_as_blocks function from the skimage.util() class. Block views can be incredibly useful when one wants to perform local operations on non-overlapping image patches.
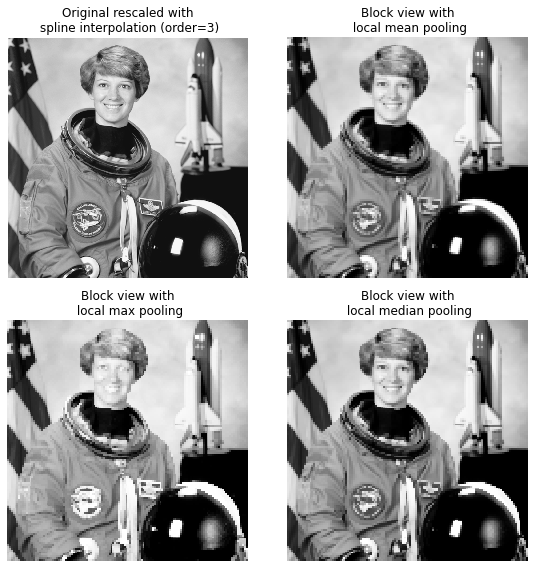
We use the astronaut image from skimage.data and virtually ‘slice’ it into square blocks. Then, on each block, we either pool the mean, the max or the median value of that block using the corresponding NumPy functions. The results are displayed together, along with a spline interpolation of order 3 rescaling of the original astronaut image (using SciPy ndimage.zoom() method.
import numpy as np
from scipy import ndimage as ndi
from matplotlib import pyplot as plt
import matplotlib.cm as cm

from skimage import data
from skimage import color
from skimage.util import view_as_blocks
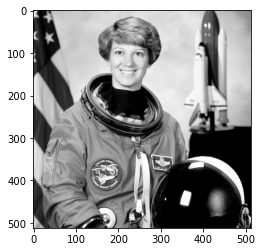
5.1. Get the astronaut image from the skimage.data in grayscale (use color.rgb2gray())
l = color.rgb2gray(data.astronaut())
plt.imshow(l,cmap=cm.Greys_r)
plt.show()
l.shape
(512, 512)
l.size
262144
5.2. Size of the blocks
block_shape = (4, 4)
5.3. Transform the image as a matrix of blocks (of shape block_shape) and flatten. Examine shapes and sizes
view = view_as_blocks(l, block_shape)
view.size
262144
view.shape
(128, 128, 4, 4)
# collapse the last two dimensions in one
flatten_view = view.reshape(view.shape[0], view.shape[1], -1)
flatten_view.shape
(128, 128, 16)
flatten_view.size
262144
5.4. Resampling the image by taking either the mean, the max or the median value of each blocks
mean_view = np.mean(flatten_view, axis=2)
max_view = np.max(flatten_view, axis=2)
median_view = np.median(flatten_view, axis=2)
5.5. Display resampled (and a zoomed version with spline interpolation) side by side
fig, axes = plt.subplots(2, 2, figsize=(8, 8), sharex=True, sharey=True)
ax = axes.ravel()

# Resized by spline interpolation (SciPy ndimage method)
l_resized = ndi.zoom(l, 2, order=3)
ax[0].set_title("Original rescaled with\n spline interpolation (order=3)")
ax[0].imshow(l_resized, extent=(0, 128, 128, 0), interpolation='nearest',
             cmap=cm.Greys_r)

ax[1].set_title("Block view with\n local mean pooling")
ax[1].imshow(mean_view, interpolation='nearest', cmap=cm.Greys_r)

ax[2].set_title("Block view with\n local max pooling")
ax[2].imshow(max_view, interpolation='nearest', cmap=cm.Greys_r)

ax[3].set_title("Block view with\n local median pooling")
ax[3].imshow(median_view, interpolation='nearest', cmap=cm.Greys_r)

for a in ax:
    a.set_axis_off()

fig.tight_layout()
plt.show()
5.6. Print the size of the sampled images vs. the re-sized (interpolated) image
print("Size of the resized image:", l_resized.size)
print("Size of the mean image:", mean_view.size)
print("Size of the max image:", max_view.size)
print("Size of the median image:", median_view.size)
Size of the resized image: 1048576
Size of the mean image: 16384
Size of the max image: 16384
Size of the median image: 16384