6. Canny edge detector
The Canny filter is a multi-stage edge detector. It uses a filter based on the derivative of a Gaussian in order to compute the intensity of the gradients.
The Gaussian reduces the effect of noise present in the image. Then, potential edges are thinned down to 1-pixel curves by removing non-maximum pixels of the gradient magnitude. Finally, edge pixels are kept or removed using hysteresis thresholding on the gradient magnitude.
The Canny has three adjustable parameters:
the width of the Gaussian (the noisier the image, the greater the width),
low threshold for the hysteresis thresholding,
high threshold for the hysteresis thresholding.
import numpy as np
import matplotlib.pyplot as plt
from scipy import ndimage as ndi

from skimage import feature
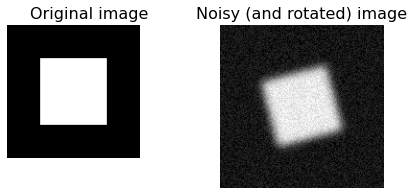
6.1. Generate noisy (and rotated) image of a square
im = np.zeros((128, 128))
im[32:-32, 32:-32] = 1

im_noisy = ndi.rotate(im, 15, mode='constant')
im_noisy = ndi.gaussian_filter(im_noisy, 4)
im_noisy += 0.2 * np.random.random(im_noisy.shape)
fig, (ax1, ax2) = plt.subplots(nrows=1, ncols=2, figsize=(7, 3),sharex=True, sharey=True)

ax1.imshow(im, cmap=plt.cm.gray)
ax1.axis('off')
ax1.set_title('Original image', fontsize=16)

ax2.imshow(im_noisy, cmap=plt.cm.gray)
ax2.axis('off')
ax2.set_title('Noisy (and rotated) image', fontsize=16)

plt.show()
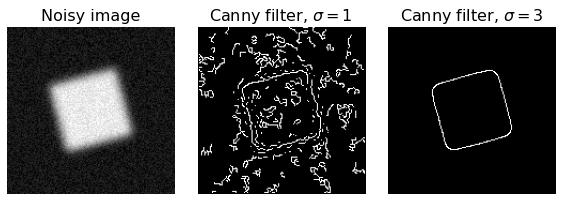
6.2. Compute the Canny filter for two values of sigma
edges1 = feature.canny(im_noisy, sigma=1)
edges2 = feature.canny(im_noisy, sigma=3)
fig, (ax1, ax2, ax3) = plt.subplots(nrows=1, ncols=3, figsize=(8, 3),
                                    sharex=True, sharey=True)

ax1.imshow(im_noisy, cmap=plt.cm.gray)
ax1.axis('off')
ax1.set_title('Noisy image', fontsize=16)

ax2.imshow(edges1, cmap=plt.cm.gray)
ax2.axis('off')
ax2.set_title('Canny filter, $\sigma=1$', fontsize=16)

ax3.imshow(edges2, cmap=plt.cm.gray)
ax3.axis('off')
ax3.set_title('Canny filter, $\sigma=3$', fontsize=16)

fig.tight_layout()

plt.show()
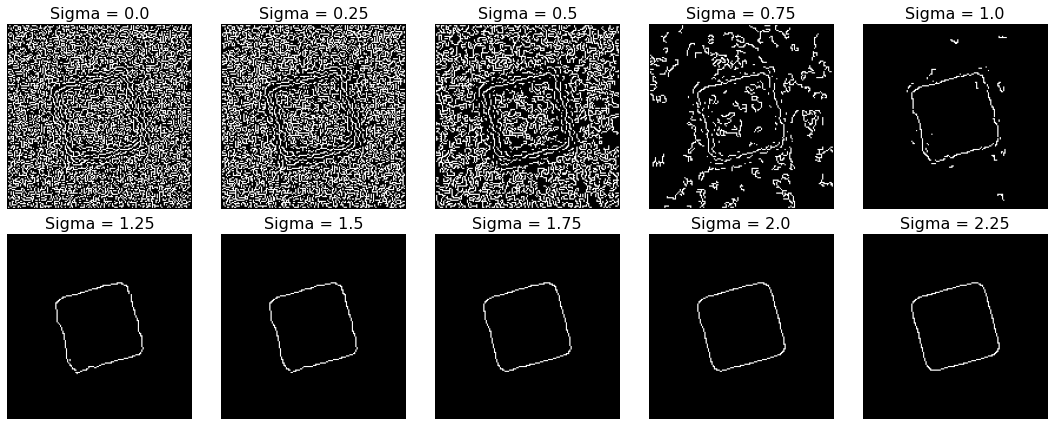
6.3. And now, a series of progressively sharper Canny filters (increasing sigma)
edges =[]

for i in [0.25*i for i in range(1,11)]:
    edges.append(feature.canny(im_noisy, sigma=i))

fig, axes = plt.subplots(figsize=(15,6),nrows=2, ncols=5, sharex=True, sharey=True)

for i in range(10):
    axes.flat[i].imshow(edges[i],cmap=plt.cm.gray)
    axes.flat[i].set_axis_off()
    axes.flat[i].set_title("Sigma = {}".format(0.25*i),fontsize=16)
fig.tight_layout()
plt.show()